


YouTube Analytics: Key Metrics to Grow Your Channel
Have you ever wondered why some YouTube channels skyrocket while others stay stagnant?
Understanding YouTube analytics is the key to your success. This treasure trove of insight helps you make data-driven decisions for your content strategy that can boost reach and engagement.
Maekersuite’s AI-powered video tools go hand-in-hand with YouTube analytics. Our platform interprets this data to offer video content solutions that resonate with your target audience. For example, our YouTube Search Trends tool streamlines your transition from data to decisive action.
In this article, we’ll guide you through the key metrics in YouTube analytics. With these actionable insights, you can optimize and empower your content strategy.
What is YouTube Analytics, and is it Free?
Think of YouTube analytics as your control center. It's an integral part of YouTube Studio and offers an in-depth look at various metrics.
YouTube analytics helps you gather and analyze data to understand how well your videos are doing, who your audience is, and what keeps them engaged.
Now, regarding the cost of YouTube video analytics, the good news is that it’s free. As a part of YouTube Studio, the analytics feature comes at no extra cost. Anyone with a YouTube channel can access it. It's a go-to tool for newcomers and seasoned creators.
It means you can explore your data and optimize your content strategy without any financial strings attached.
Why is YouTube Analytics Important?
Let's look at it in the context of YouTube's incredible reach through YouTube video statistics:
- The platform has more than 2.7 billion monthly active users in 2024.
- YouTube is the third-largest search engine, behind only Google and Google Images. It's a space with vast potential but also fierce competition.
- Creators upload more than 500 hours of content every minute on YouTube.
- YouTube is the most used video marketing platform, with 90% of marketers on board. In 2022, YouTube raked in $29.2 billion in revenue, a 48% increase from 2020. This growth reflects how essential YouTube has become in the global digital era.
In a space so dynamic, guesswork won't cut it. You need data-driven decisions to maximize the impact of your videos. YouTube video analytics becomes your best ally for staying relevant, attracting new viewers, and retaining your existing audience. It equips you with the insights you need to fine-tune your content and grow your channel.
How to Use YouTube Analytics
To make informed decisions, access to accurate data is vital. YouTube analytics provides this essential data. Knowing where to find these analytics is your first step toward channel optimization. Follow the steps below for a straightforward guide to learn more about YouTube video analytics.
Accessing YouTube Analytics through Desktop
Before diving into the numbers, know where to look for them. YouTube analytics comes under YouTube Studio. This is your dashboard for channel management.
Step 1: Log in and Locate Profile Icon

Log in to YouTube. Find your profile icon at the top right of the homepage.
Step 2: Navigate to YouTube Studio
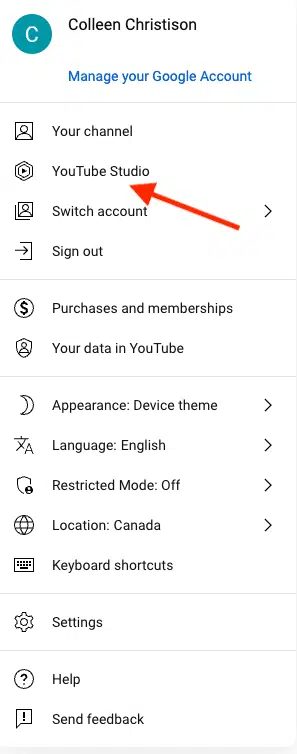
Click your profile icon. Next, choose 'YouTube Studio' from the menu.
Step 3: Find the Analytics Icon
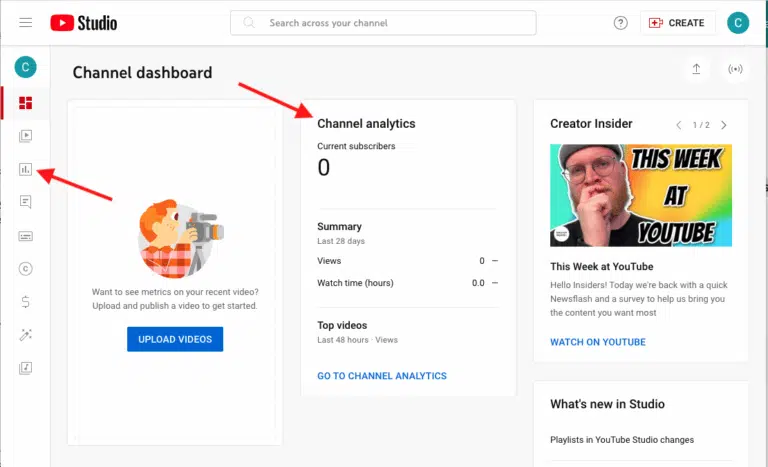
Once in YouTube Studio, locate the analytics icon. It's on the left-hand menu.
Step 4: Overview or Specific Metrics
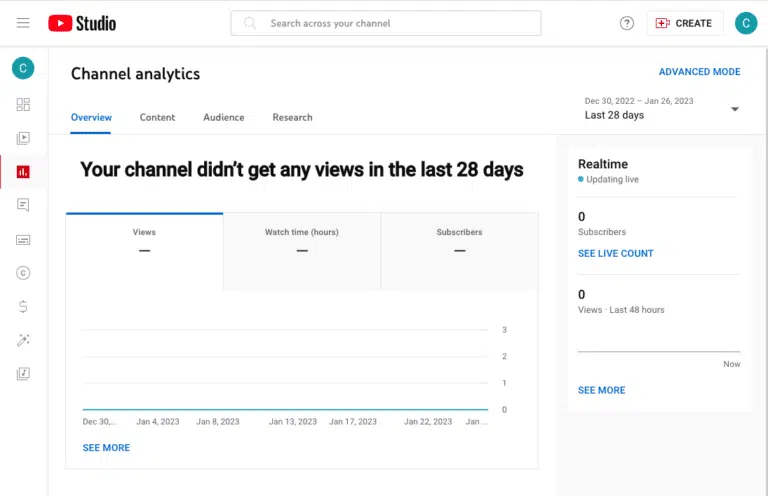
You'll see an analytics overview here. You can also navigate to 'content,' 'audience,' or 'research' for more detailed information.
Step 5: Unlock Advanced Mode
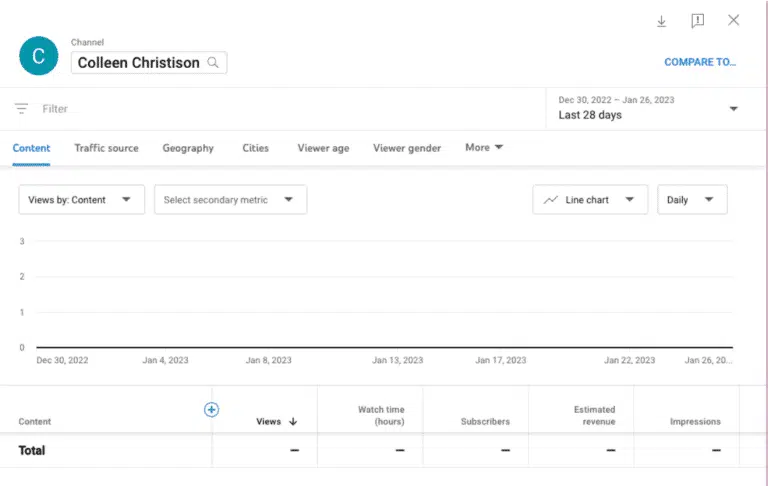
For deeper insights, click 'Advanced Mode' in the upper right. This offers a detailed breakdown of channel and video metrics.
Step 6: Download a Report
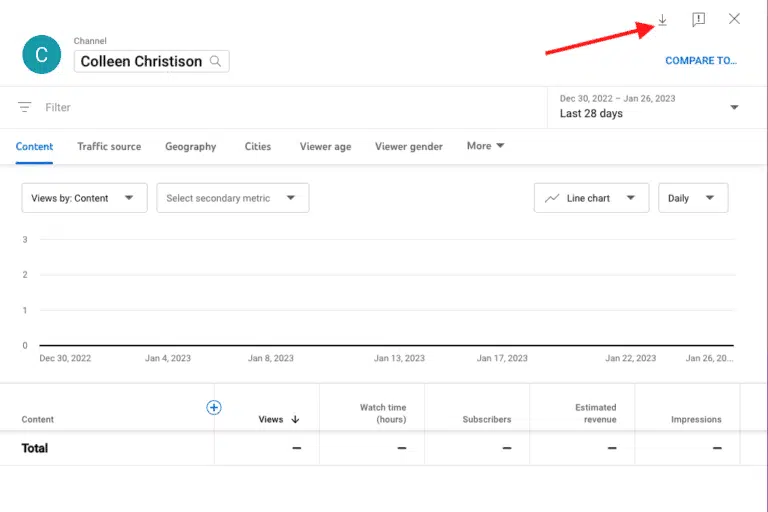
In Advanced Mode, set the parameters you want to track. Then click on the downward pointing arrow located in the upper right corner. Choose between Google Sheets or a .csv file to download your report.
Each step brings you closer to actionable insights. Use this data to shape your content strategy.
Accessing YouTube Analytics through Mobile
YouTube analytics is accessible through the YouTube Studio mobile app. If it's not installed, download it from the App Store for iPhone or Google Play for Android. Then, follow the steps given below to leverage YouTube analytics from mobile.
Step 1: Open the App and Sign In
Open the YouTube Studio app on your mobile. Log in to your account for dashboard access.
Step 2: Find Summary Metrics
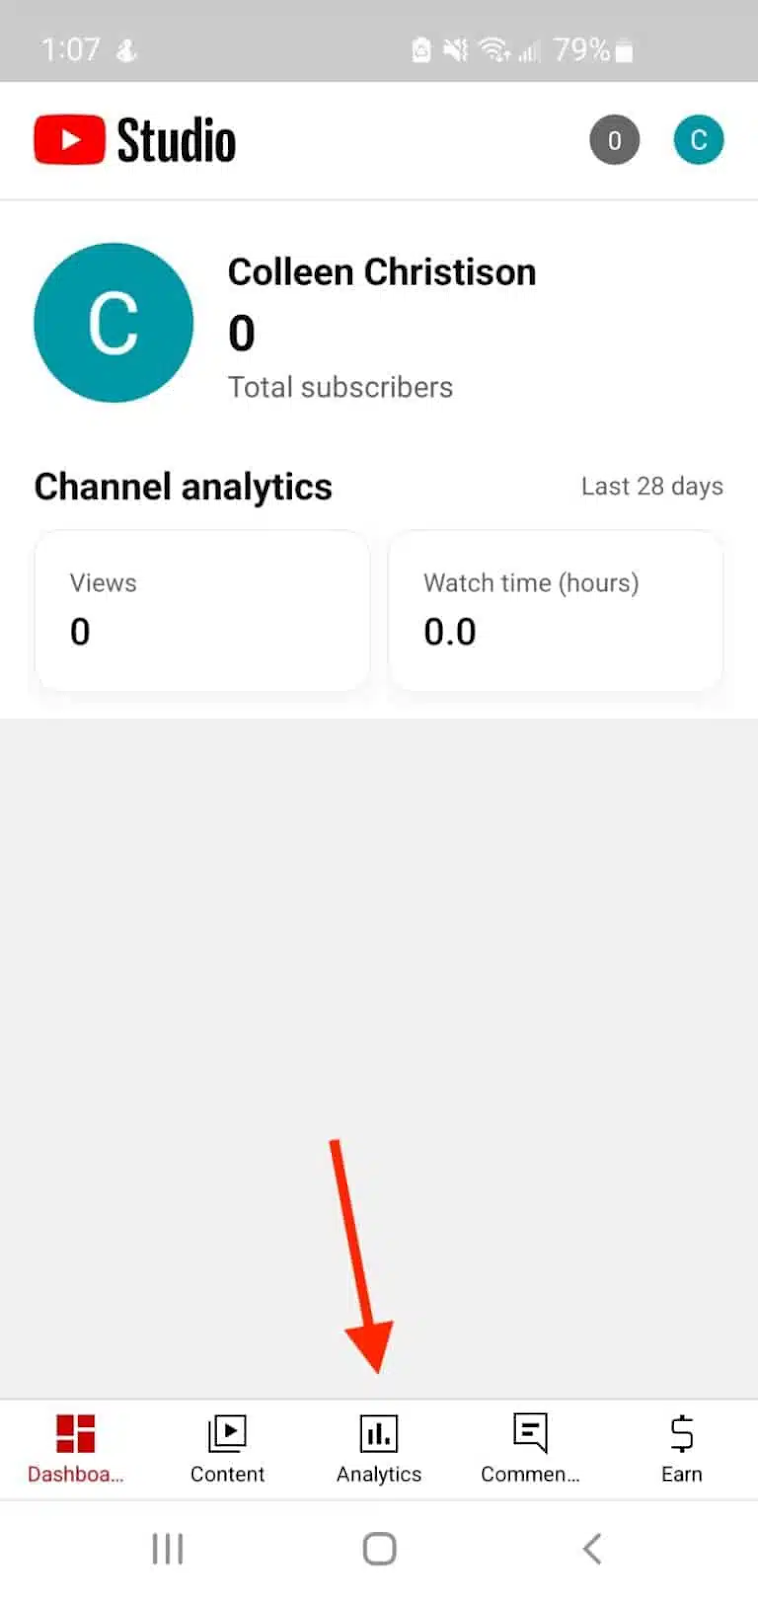
The main dashboard presents you with summary metrics. For a more detailed look, click 'Analytics' at the bottom of your screen.
Step 3: Toggle for Specific Insights
You'll see options like 'Research,' 'Overview,' 'Content,' and 'Audience' at the top. Toggle between these according to what information you want.
Mobile access means you can check your analytics on the go. Use this data to refine your YouTube strategy.
Important YouTube Metrics to Track
YouTube analytics provide rich insights into your channel's performance. These insights fall into four main categories:
- Overview
- Content
- Audience
- Research Metrics
While YouTube Studio offers so much data, certain metrics stand out for their relevance. A total of 15 key metrics deserve your attention. Knowing these metrics can help you make informed decisions for channel growth.
15 Key Metrics
1. Watch time
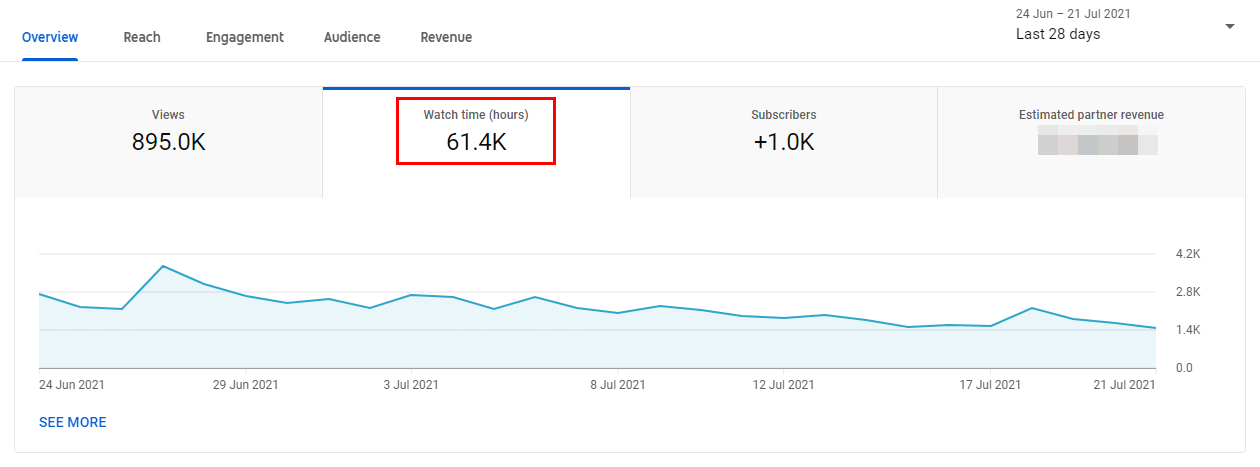
Watch time measures the total minutes viewers have spent watching your videos on YouTube. This metric serves as a strong indicator of your content's popularity and engagement level. YouTube uses watch time as a critical factor in its algorithm to determine a video's ranking and visibility.
Increasing your video's watch time boosts its likelihood of appearing in search results and recommendations. It contributes to channel monetization.
How to Find It: YouTube Studio > Analytics > Overview>Watch time.
2. Average Percentage Viewed
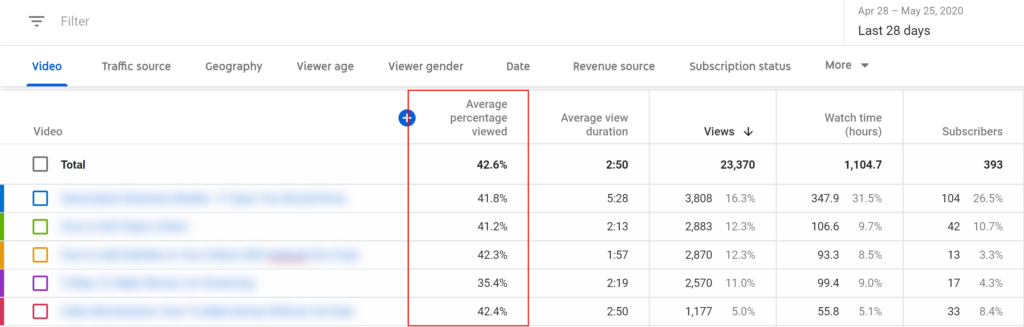
The average percentage viewed indicates the part of each video viewers watch. This metric, expressed as a percentage, helps you understand viewer engagement throughout a video.
For instance, an average viewing percentage of 70% suggests that viewers generally watch 70% of your video. This is valuable for YouTube optimization. A higher percentage indicates that your video maintains interest and relevance, which is favorable in YouTube's algorithm. Low percentages may prompt you to review and improve your video structure or content quality.
How to Find It: YouTube Studio > Analytics > Overview> Watch time > See More > Content > Watch time > More Metrics > Overview > Average percentage viewed.
3. Average View Duration
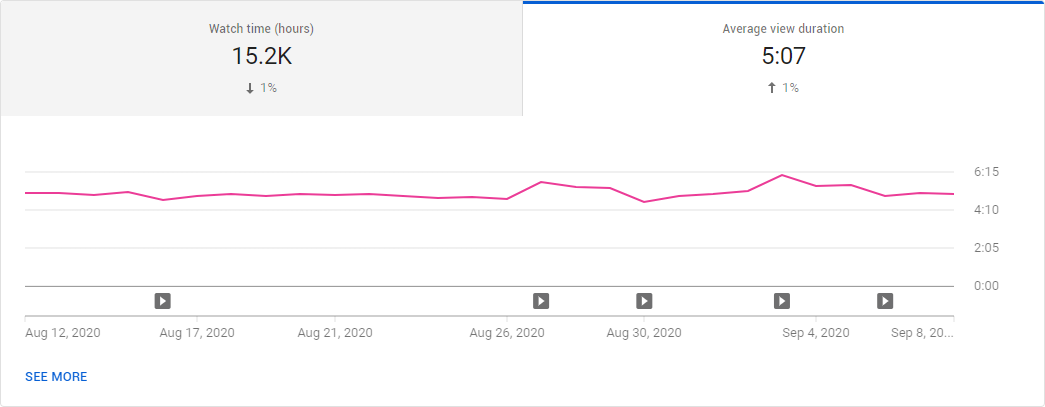
Average View Duration is the average time a viewer has watched a video on your channel. YouTube highlights this metric in minutes and seconds. It offers insights into how engaging or interesting your content is.
A higher average view duration means your content is compelling, which can result in higher rankings in YouTube's search and recommendation features.
A lower average view duration might say that your content isn't capturing viewers' attention, signaling a need for improvement.
How to Find It: YouTube Studio > Analytics > See More > Watch time > More Metrics > Overview > Average view duration.
4. Audience Retention
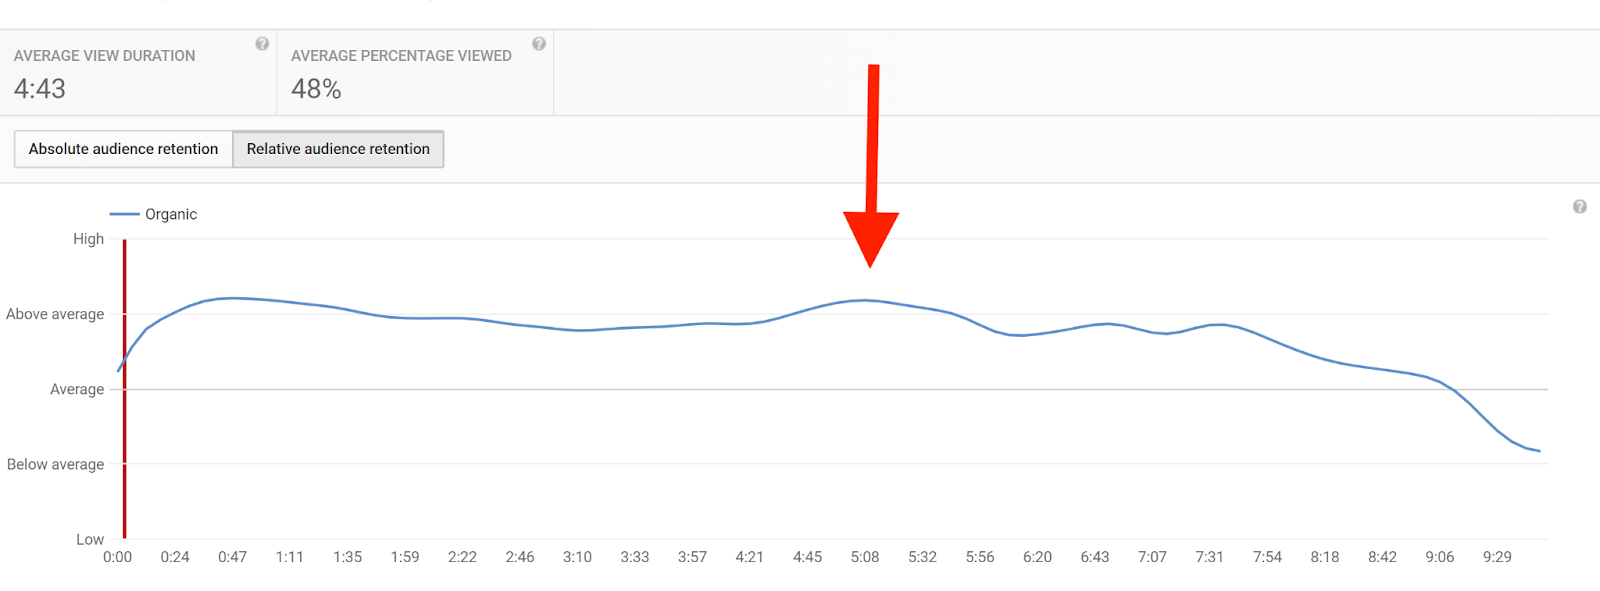
Audience Retention shows the percentage of a video that viewers have watched. It helps you understand how well your video keeps viewers engaged over its entire length.
A graph often accompanies this metric, revealing where viewers drop off or continue watching.
High audience retention can boost your video's visibility on YouTube, making it more likely to be recommended. Consider evaluating your content's pacing, relevance, or entertainment value if you notice a dip in this metric.
How to Find It: YouTube Studio > Analytics > Engagement > Audience retention.
5. Re-watches
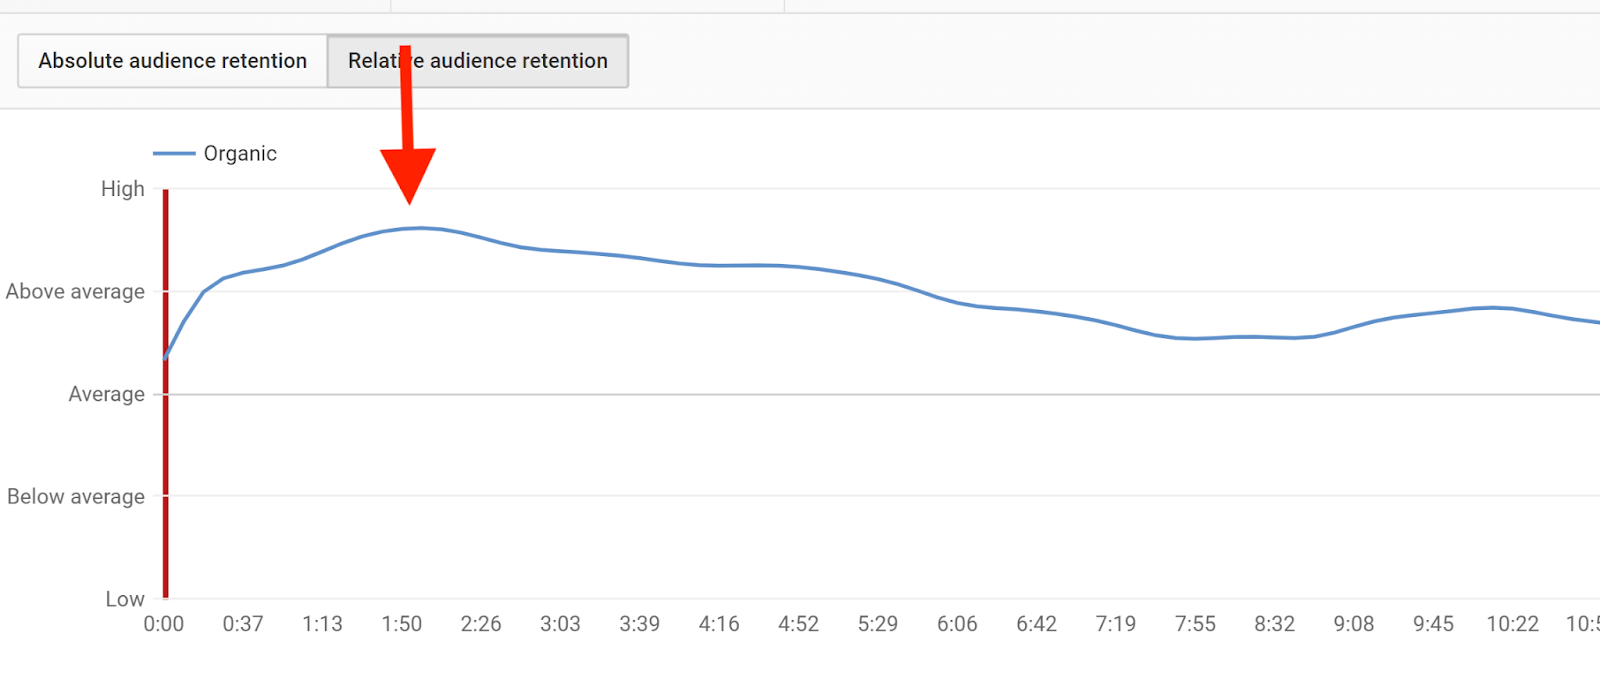
Re-watches show the number of times viewers have returned to watch your video again. This metric is a strong signal of your content's quality and value.
Videos with high re-watch rates are likely engaging, informative, or entertaining. It's an important data point for content creators, as it can hint at what type of content gets not only views but multiple views from the same user.
If this number is high, you're likely onto something your audience appreciates. Keep an eye on this metric to fine-tune your content strategy.
How to Find It: YouTube Studio > Analytics > Engagement > Audience retention > Absolute audience retention.
6. Engagement

Engagement tracks audience interaction with your video through likes, dislikes, comments, and shares.
High engagement often signals that viewers find your content compelling. YouTube also considers this metric when ranking your videos in search results. Thus, better engagement can lead to more visibility for your channel.
To improve this metric, aim to create content that encourages interaction through a call-to-action or captivating subject matter.
How to Find It: YouTube Studio > Analytics > Engagement > Likes (vs. dislikes) > See More.
7. Impressions Click-Through Rate

Impressions Click-Through Rate (CTR) shows how often viewers click on your video after seeing its thumbnail or title. This rate helps you understand the effectiveness of your video's first impression. A high CTR often means your video is attractive and relevant to the audience.
Keep in mind that a lower CTR isn't always bad. It might mean the video has a broader reach. Fine-tuning your video titles, thumbnails, and descriptions can improve this metric.
How to Find It: YouTube Studio > Analytics > Reach > Impressions click-through rate.
8. Card Clicks
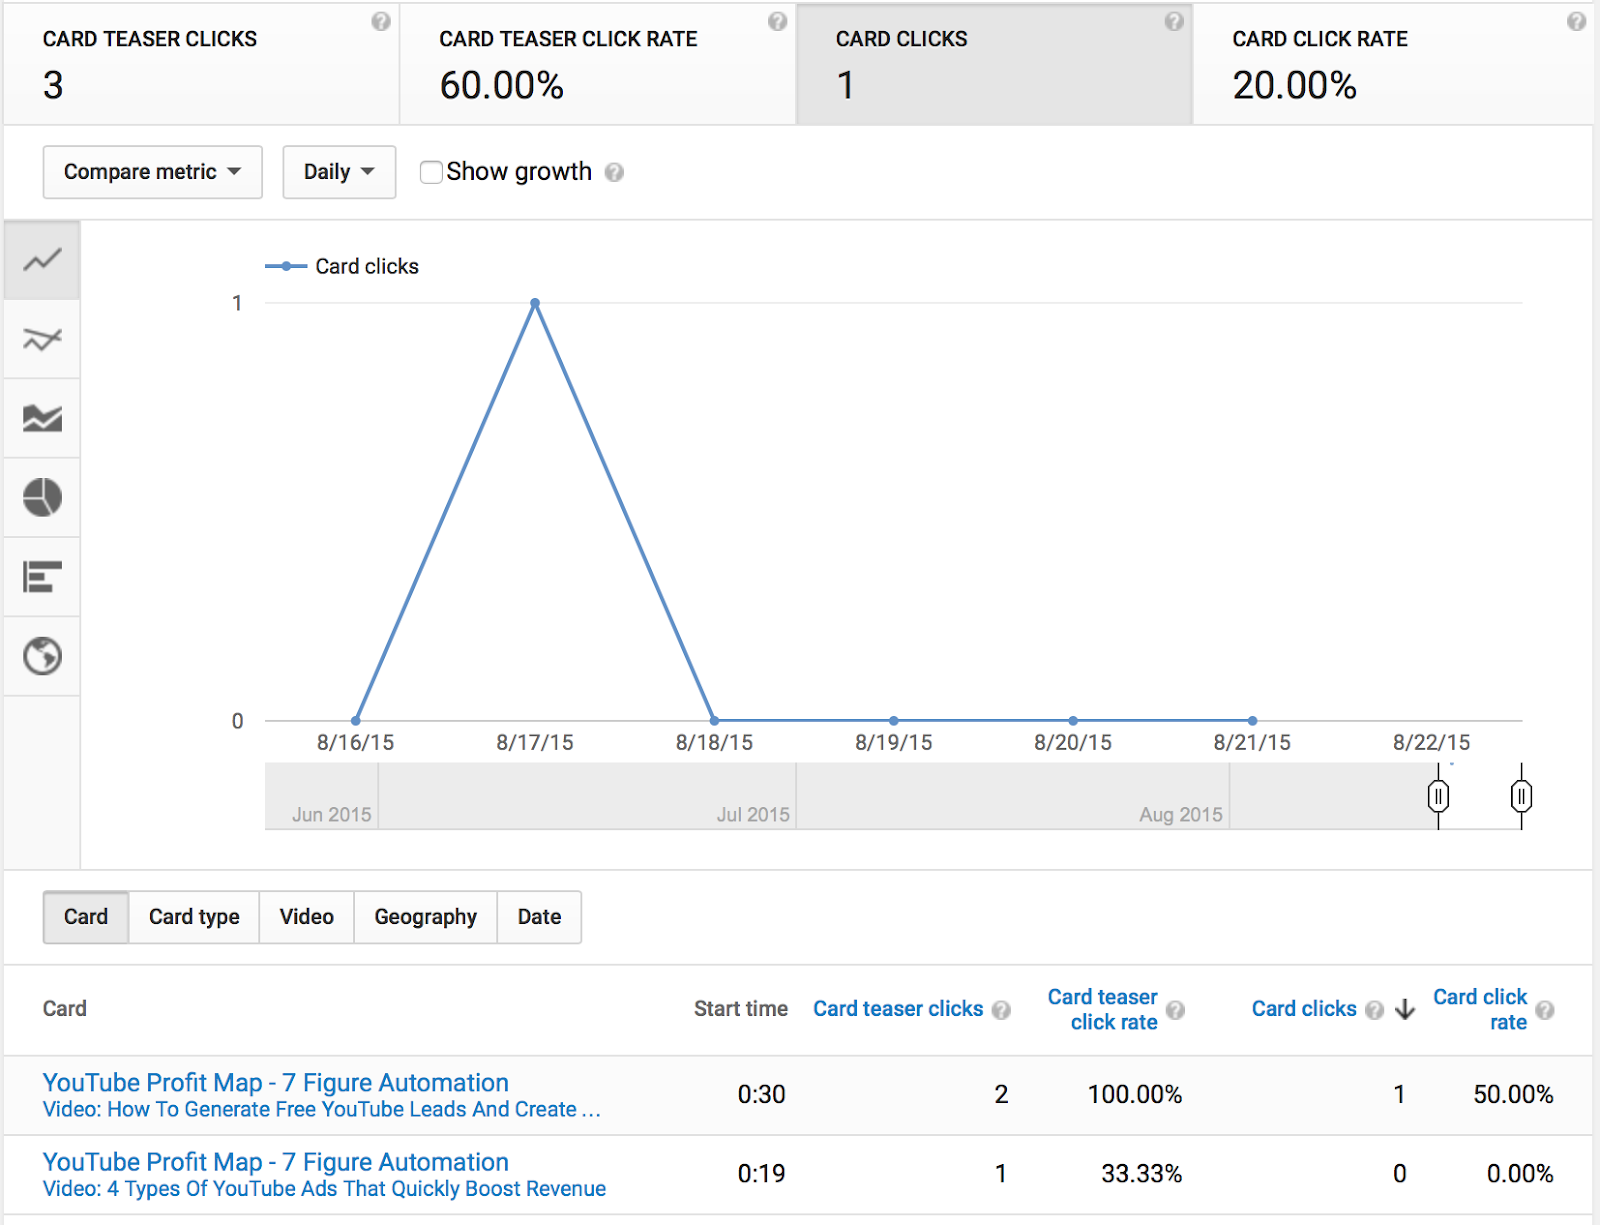
Card Clicks indicate the number of times a viewer has clicked on a card you've added to a video. Cards are interactive elements you can set up to appear during your video. They can link to other content, prompt donations, or offer more information. This metric gives insight into how your cards engage your audience.
If card clicks are low, consider revising the card's call to action or timing for better results.
How to Find It: YouTube Studio > Analytics > Reach > See More > Impressions by: Content > More Metrics > Cards > Card Clicks.
9. Playlist Engagement
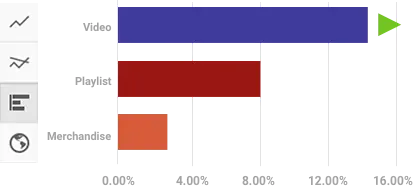
Playlist Engagement measures how often viewers interact with your playlists. The audience can do this either by starting a playlist or by watching subsequent videos in it.
A high level of playlist engagement often means your content is compelling and encourages viewers to watch more. If you see this number is low, think about improving your playlist titles or the sequence of videos to keep your audience engaged.
How to Find It: YouTube Studio > Analytics > Engagement > See More > Watch Time > More Metrics > Playlists.
10. Unique Viewers
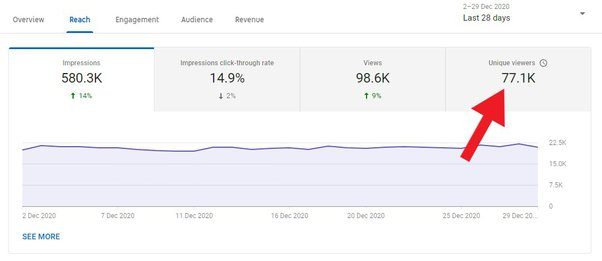
Unique Viewers count the people who have watched your videos over a certain period. Unlike total views, which can include multiple views by the same user, this metric gives you a more accurate picture of your audience size.
If this number grows, you're expanding your audience. If it's stable or decreasing, consider strategies to attract new viewers.
How to Find It: YouTube Studio > Analytics > Audience > Unique viewers.
11. Views Per Unique Viewers
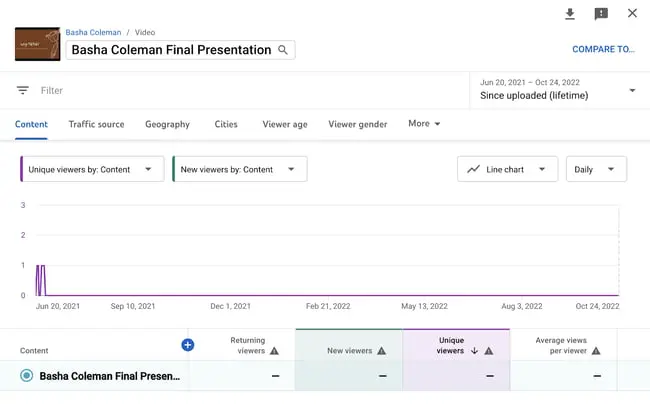
Views per unique viewer calculate the average number of times each unique viewer has watched your content. This metric helps you gauge how often people come back to watch your videos.
A high number could mean your content is engaging and encourages repeat views. A low number might suggest that they aren't returning for more while you're reaching new people. Use this metric to tailor your content strategy.
How to Find It: YouTube Studio > Analytics > Audience > Unique viewers > See More > Average views per viewer.
12. Who’s Watching Your Videos
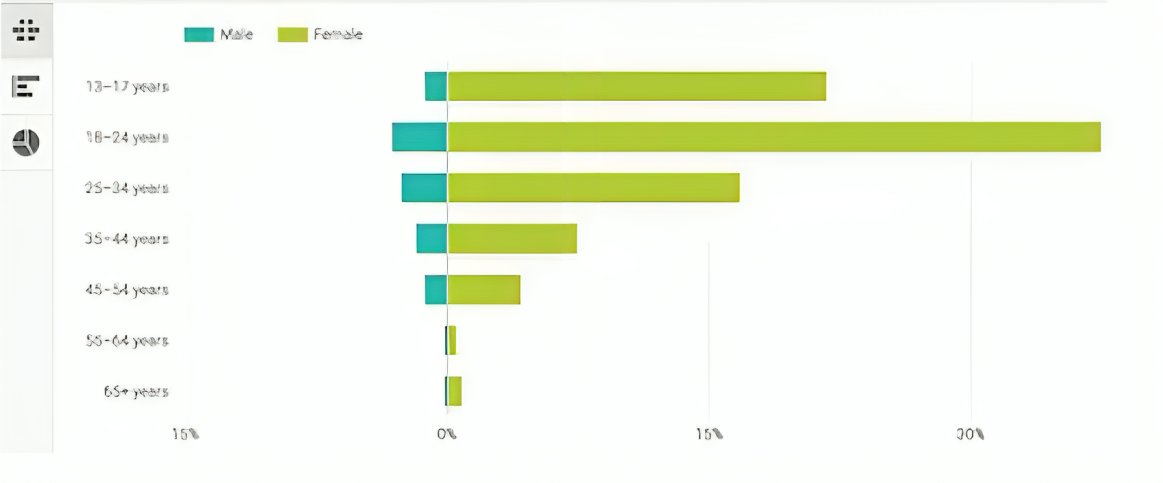
The "Who's Watching Your Videos" metric shows your audience's demographics, such as age, gender, and location. This data is crucial for targeting your content and optimizing viewer engagement.
For example, if you notice a strong following from a specific country, consider creating content that resonates with that audience. This metric helps you make informed decisions to grow your channel.
How to Find It: YouTube Studio > Analytics > Audience > Age and Gender.
13. Subscriber Growth

"Subscriber Growth" shows the rate at which your channel gains or loses subscribers over time. Understanding this metric can help you tailor your content to your audience's wants.
A rising number signifies that your content resonates with viewers, turning them into loyal followers. If you notice a sudden drop, it's a cue to reevaluate your content strategy.
How to Find It: YouTube Studio > Analytics > Audience > Subscribers.
14. Traffic Sources
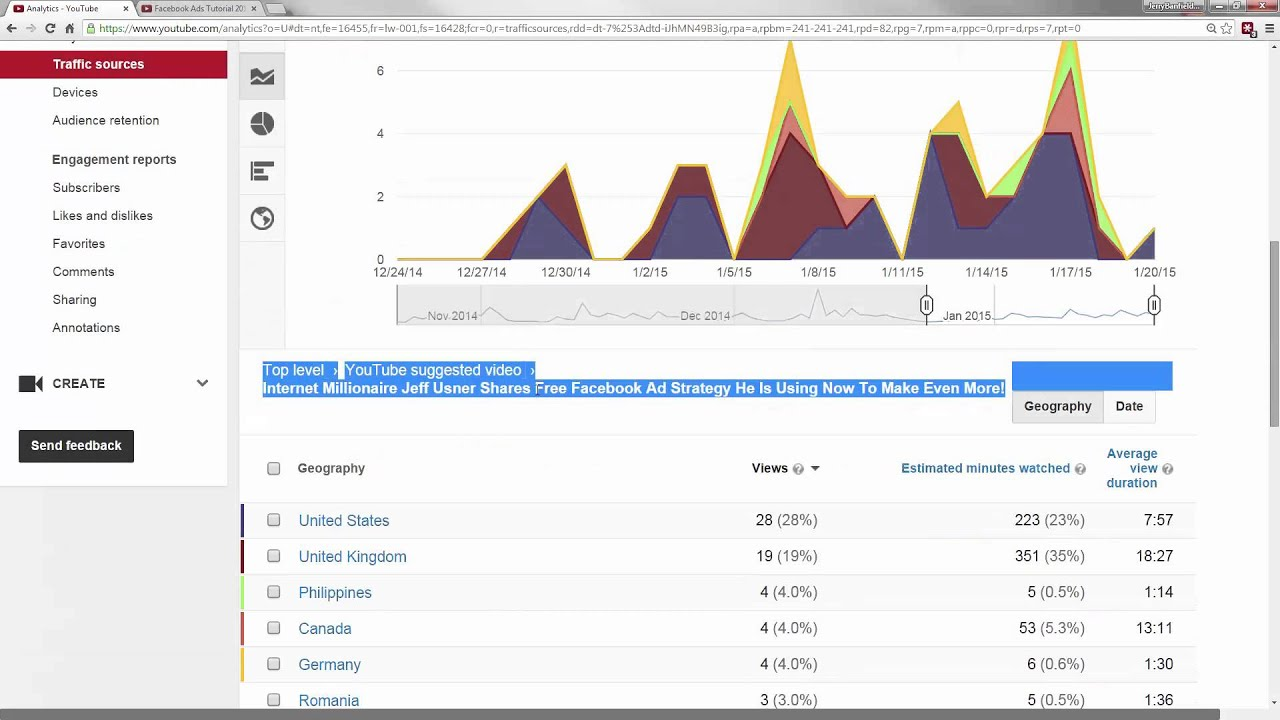
"Traffic Sources" indicates where viewers are finding your content. It could be through YouTube searches, suggested videos, or external sites. Knowing this can help you understand which platforms are most effective for driving views.
For example, your thumbnails and titles are likely compelling if most traffic comes from suggested videos. If the search volume is high, your SEO tactics are working. This metric offers a roadmap for where to focus your promotional efforts.
How to Find It: YouTube Studio > Analytics > Audience > Subscribers > See More > Traffic Source.
15. Keywords

"Keywords" show the search terms that lead viewers to your content. This metric is crucial for SEO (Search Engine Optimization). Knowing which keywords are bringing in your audience, you can optimize around them.
For example, if "easy recipes" attract many viewers, consider creating more content around easy cooking tips. It helps you align your content strategy with what your audience is searching for.
How to Find It: YouTube Studio > Analytics > Reach > YouTube Search terms.
Grow Your Channel With Maekersuite
We've discussed the importance of YouTube analytics, how to access them via desktop and mobile, and the key metrics to track. These analytics offer a wealth of information, but using tools like Maekersuite can take your channel to the next level.
Maekersuite's AI-powered tools streamline content creation, making it more efficient and impactful:
- With the Video Content Planner, plot your video strategies with ease.
- The Video Title Generator helps craft engaging titles, while the YouTube Script Generator helps you create compelling video scripts.
- Finally, optimize your video's SEO with the YouTube Description Generator.
We designed these tools to resonate with your target audience and grow your channel. So why not give your YouTube analytics a boost with Maekersuite?


%252520(500%252520%2525C3%252597%252520300px).png)


